

Technical Analysis of Gold (XAU/USD): Examining the Triangle Pattern and Price Prediction
Technical Analysis of Gold (XAU/USD): Examining the Triangle Pattern and Price Prediction
The gold market (XAU/USD) consistently remains one of the most volatile and appealing financial markets for traders. Technical analysis empowers traders to make more informed decisions by identifying price patterns and key levels. In this article, we meticulously examine the XAU/USD chart to pinpoint the emerging triangle pattern and forecast the probable direction of gold price prediction. Our focus is on the one-hour timeframe, which offers a short-term view of market trends and helps us analyze gold analysis in this specific period.
Current Pattern in the XAU/USD Chart
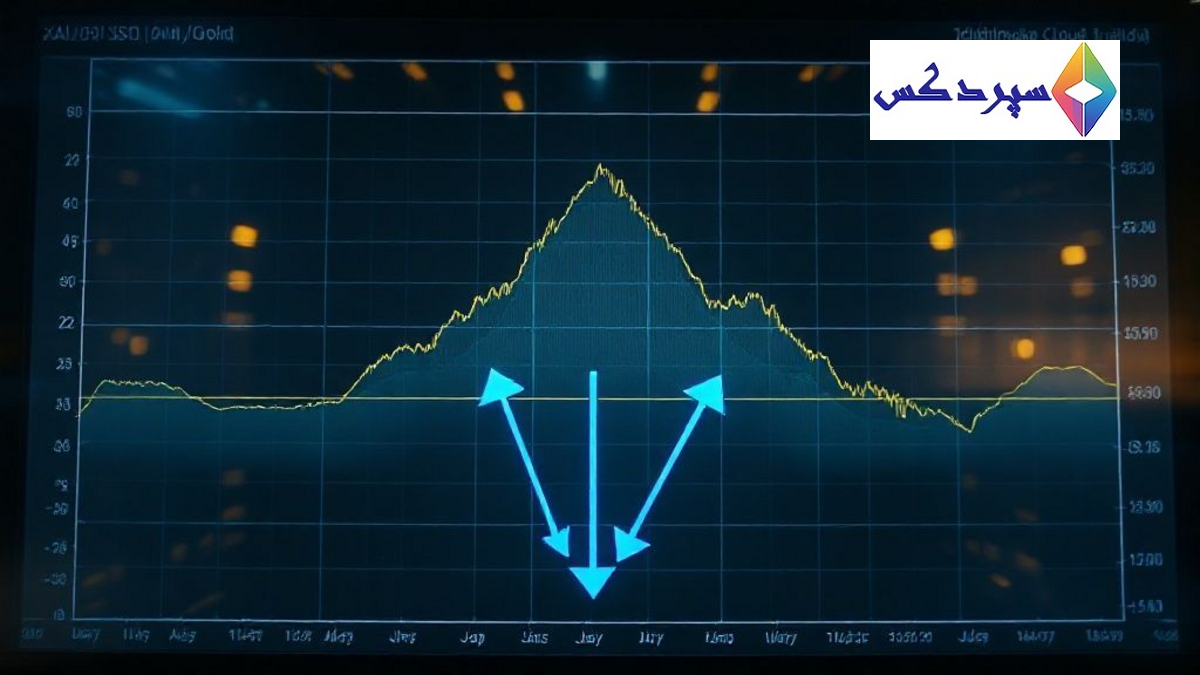
Currently, the one-hour (1H) chart for gold (XAU/USD) reveals the formation of a descending or symmetrical triangle pattern. These chart patterns typically indicate a period of price consolidation before a strong move in the direction of the breakout, proving useful for gold forecast.
- Price Range: The gold price is currently fluctuating around $4000 to $4005. This range represents the market’s current focal point, with analysts closely monitoring gold analysis at this level.
- Support Trendline: The support trendline (the lower boundary of the triangle) has undergone multiple tests. Each time a support level is repeatedly tested, its potential for weakness increases, making a downside break more probable.
- Ichimoku Cloud: The Ichimoku Cloud appears flat, and the price is situated below the cloud’s mid-section. This situation suggests a slight bearish bias in the gold market, potentially confirming the likelihood of a downside bearish breakout. Understanding technical indicators like Ichimoku can significantly enhance your trading insights. For more detailed insights into technical reports, you can explore educational resources and analysis reports.
Probable Breakout Direction and Price Targets
Given the formation of the triangle pattern and other technical indicators, the chart shows blue arrows pointing downwards, signaling an anticipation of a bearish breakout. This breakout could present excellent trading opportunities for sellers and represents a crucial XAU/USD analysis.
Price Targets Following a Bearish Breakout
Based on our gold analysis, two primary price targets exist for this potential downward movement:
- First Target: Around $3975 to $3980. This is the initial short-term target after the descending triangle pattern breaks, and it could serve as a good point for initial profit-taking.
- Second Target: Around $3920 to $3925. If the bearish momentum persists and the price moves past the first target, this level will act as an extended downside target.
Key Levels to Monitor for Gold Trading
Identifying support and resistance levels is crucial for managing risk and optimizing entry and exit points in your trading strategy.
- Resistance: The $4020 to $4030 area functions as a significant resistance level. A price move above this level could invalidate the bearish scenario.
- Breakout Zone (Sell Confirmation): A one-hour candle closing below $3995 will provide strong confirmation to enter a sell position, defining a clear gold trading strategy.
- Support/Buy Zone: The $3920 to $3925 area is not only our second downside target but also a strong support zone. If the price reaches this level, it presents potential for a rebound or buying opportunity. To stay informed about the latest market developments, you can follow related news headlines.
Summary of Gold Trading Strategy
Here is a summary of the proposed strategy based on the above gold technical analysis:
- Action: Sell below $3995
- Target (Target): 🎯 $3975 (First profit-taking point)
- Continue Holding/Selling: 🎯 $3920 (Final target zone)
- Stop Loss (Stop Loss): 🔺 $4030 (Above the upper trendline of the triangle)
This gold analysis offers a technical perspective and should not constitute financial advice. Traders must always conduct their own research and consider the inherent risks associated with trading. For more comprehensive information, refer to the news source.
Frequently Asked Questions (FAQ)
What is the main focus of this Gold Technical Analysis (XAU/USD)?
This technical analysis focuses on examining the price pattern formed on the one-hour Gold (XAU/USD) chart, primarily a descending or symmetrical triangle pattern, and predicting the probable direction of price movement after the pattern breaks.
What technical pattern is currently identified on the XAU/USD chart, and what does it signify?
Currently, the one-hour Gold (XAU/USD) chart shows the formation of a descending or symmetrical triangle pattern. These patterns typically indicate a period of price consolidation before a strong move in the direction of the breakout, and this analysis predicts a bearish breakout.
What other technical indicators confirm the predicted bearish breakout in gold price?
In addition to the triangle pattern, the support trendline has been tested multiple times, indicating its potential weakness. Also, the Ichimoku Cloud is flat, and the price is below the cloud’s mid-section, all of which confirm a slight bearish bias in the market and increase the probability of a downside breakout.
What are the price targets and key levels for risk management if a bearish breakout in gold occurs?
Following a bearish breakout, price targets include $3975 to $3980 (first target) and $3920 to $3925 (second target). The $4020 to $4030 area acts as a key resistance, and the suggested stop-loss is $4030. Confirmation for entering a sell position is a one-hour candle close below $3995.
Comments