

BTC Critical Phase Update
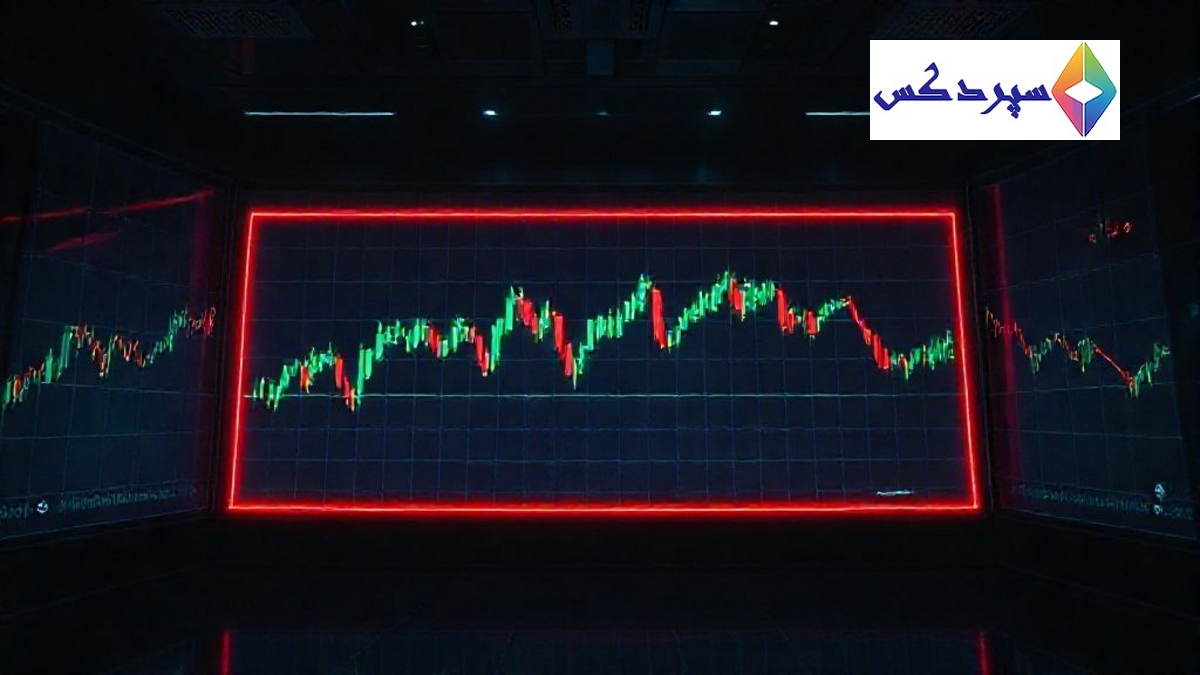
Current BTC Status From Technical Analysis
In this report, we examine the current state of the Bitcoin market from a technical perspective. Data from CRYPTOCAP:BTC indicates that Bitcoin’s price has tested a defined supply zone and is currently flat. This suggests the market is in a temporary calm until key decision factors become clearer. Traders look for reliable chart signals to base future actions on solid data.
As long as the red box on the chart is broken, BTC remains in the critical phase. This condition can provide an opportunity to more accurately assess upcoming candles and measure the strength of buyers and sellers. More precise updates after quantitative data confirmation will illuminate the market roadmap.
4-Hour Chart and Its Influence on Decision Making
Price movements on four-hour intervals carry significant weight; when the four-hour trend turns bullish, the probability of a bullish move in the coming days or hours rises. However, a four-hour trend change does not mean all short-term limits have vanished, and only when indicators and consecutive candles align upward can we expect a more sustained move.
Meanwhile, market direction is followed cautiously, and one should never assume that a chart breakout automatically leads to an all-time high. To understand short-term jumps more accurately, additional analysis of market data and related news is required.
Key Points for Investors
- A break of the red box can lead to temporary stay or short-term reversal, but it is by no means a guarantee of an ATH.
- The four-hour uptrend strengthens only if other indicators move in sync with it.
- Determining entry and exit points requires a closer look at resistance levels, supply zones, and chart data.
For related news and analysis, visit: Top News Headlines and for training and analysis reports, Training and Analysis Reports. You can also find the news source here: News Source.
Conclusion and Final Note
The main takeaway is that a red box breakout does not imply an immediate move to ATH. To paint a clearer picture of BTC’s future, the four-hour trend should be analyzed alongside additional data. By following reliable updates and educational resources, you can make smarter trading decisions.
FAQ
What is the current BTC status in the critical phase from a technical analysis perspective?
According to the report, BTC stays in the critical phase until the red box on the chart is broken; the price remains unchanged and the market is in temporary calm until key decision factors become clearer. Traders seek reliable chart signals to base their future decisions on real data.
What role does the red box play and what could be the short- or long-term consequences of its break?
The red box is a vital resistance/supply zone, and until broken by candles and indicators, BTC remains in the critical phase; a break could indicate a short-term directional shift or temporary instability, but there is no guarantee of reaching ATH and confirmation requires further data.
The importance of the 4-hour chart in investors’ decision-making and what signals can it provide?
The four-hour chart plays a pivotal role; if the four-hour trend turns upward, the probability of a bullish move in the coming days or hours increases; but this is only a preliminary signal and for a sustained move other indicators and consecutive candles must align to reach a firm conclusion.
Key tips for entry and exit by investors?
Key tips include: a break of the red box can lead to temporary stay or short-term reversal, but not a guarantee of ATH; to strengthen the bullish momentum on the 4-hour timeframe, other indicators must align; determining entry and exit points requires closer examination of resistances, supply zones and chart data.
What actions can be taken to follow updates and educational resources related to this analysis?
To review related news and more analyses, consult reliable news sources and analysis tutorials, and follow credible updates to make smarter decisions.
Comments