

BTC/USDT Chart Analysis: Is a Deeper Correction Coming?
BTC/USDT Chart Analysis: Is a Deeper Correction Coming?
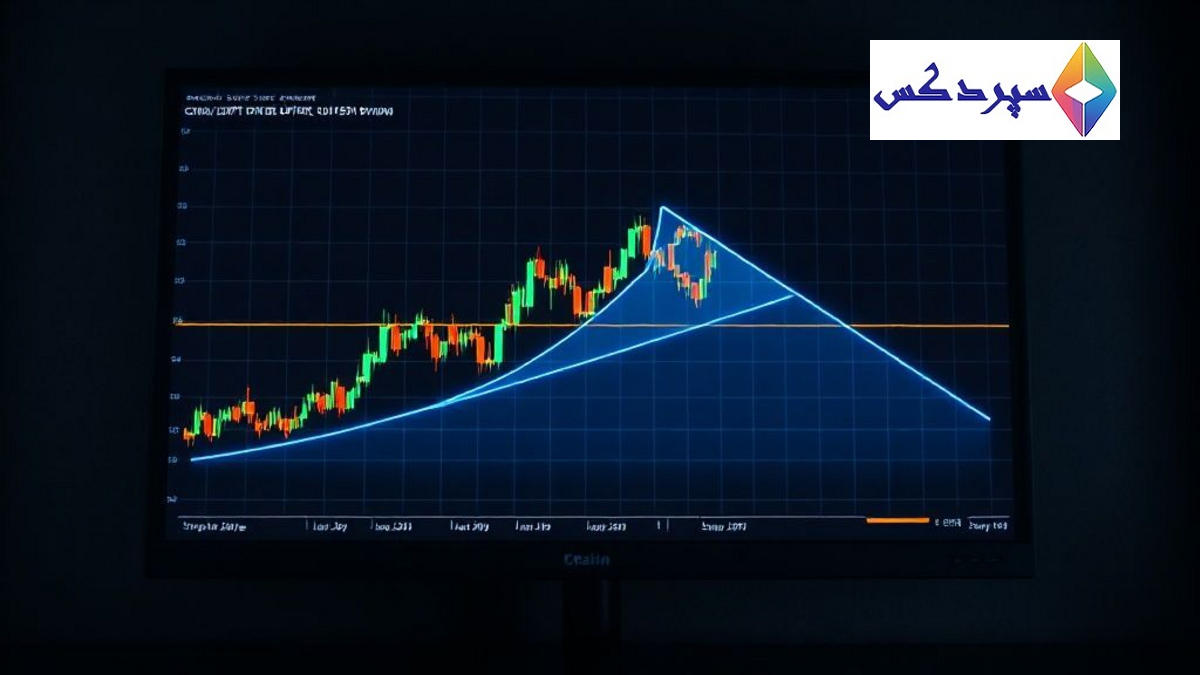
Hello to all traders and readers! This chart tells a compelling story. After price decisively breaking out of a small triangle pattern in the middle, a strong bullish rally followed. This movement demonstrates that buyers still control the market and prevent a sharp decline.
Current Chart View
Right now, a few key observations deserve close attention:
- Defensive levels: the price retraced twice and then quickly bounced back above a key support area (the blue boxes and green arrows). This behavior indicates that buyers remain active and are not letting prices slip lower easily.
- Minor warning: the diagonal blue trend line that the price was moving within has been broken. This could signal that the upside move may lose momentum and we could enter a phase of a deeper correction.
What Could Happen Next?
- Reaccumulation: if the price can reclaim the broken trend line and hold above the current support, the rally could continue.
- Risk of a decline: if the current support is decisively broken and candles close below it, prepare for a deeper correction toward the lower blue box.
Takeaway
Ultimately, the BTC/USDT market sits at a critical juncture. Monitor how price reacts to the current supports and manage risk accordingly. Sound risk management and intelligent decision-making will help you navigate volatility and seize opportunities from future trends.
For the latest news and analyses, visit the following resources:
Latest crypto headlines,
Analysis reports and tutorials,
Source of the news.
Frequently Asked Questions (FAQ)
What does the current BTC/USDT chart analysis indicate about buying strength?
As described, after the price broke out of the small triangle, a strong upward move followed, indicating buyers are in control and defending against declines. However, a break of the blue diagonal trend line could suggest that the upside momentum may wane, opening the door to a deeper correction.
What is the role of support lines and trend lines in trading decisions?
If the price reclaims the broken trend line and holds above the current support, the upside rally may continue. Conversely, a decisive break of support with candles closing below it could prepare for a deeper correction toward lower support levels.
What scenarios are most likely for the near future in this analysis?
Two main scenarios exist: 1) Reaccumulation with a sustained move above the broken trend line and current support, leading to continued upside; 2) Decline risk with a break of support and candles closing below it, increasing the chance of a deeper correction toward the lower blue box.
How should investors manage risk when using this analysis?
Carefully monitor price reactions to current supports, set stop-loss levels, determine appropriate position sizing, and make decisions based on price action to withstand market volatility.
What categorization and tags are used for this analysis?
The content is categorized under Crypto News, with the tag Bitcoin; related keywords include BTC/USDT chart analysis, BTC/USDT support and resistance, and BTC price trend, indicating a focus on these topics.
Comments