

MYRO/USDT Breaks Out From Inverse Head and Shoulders
MYRO/USDT Breaks Out From Inverse Head and Shoulders
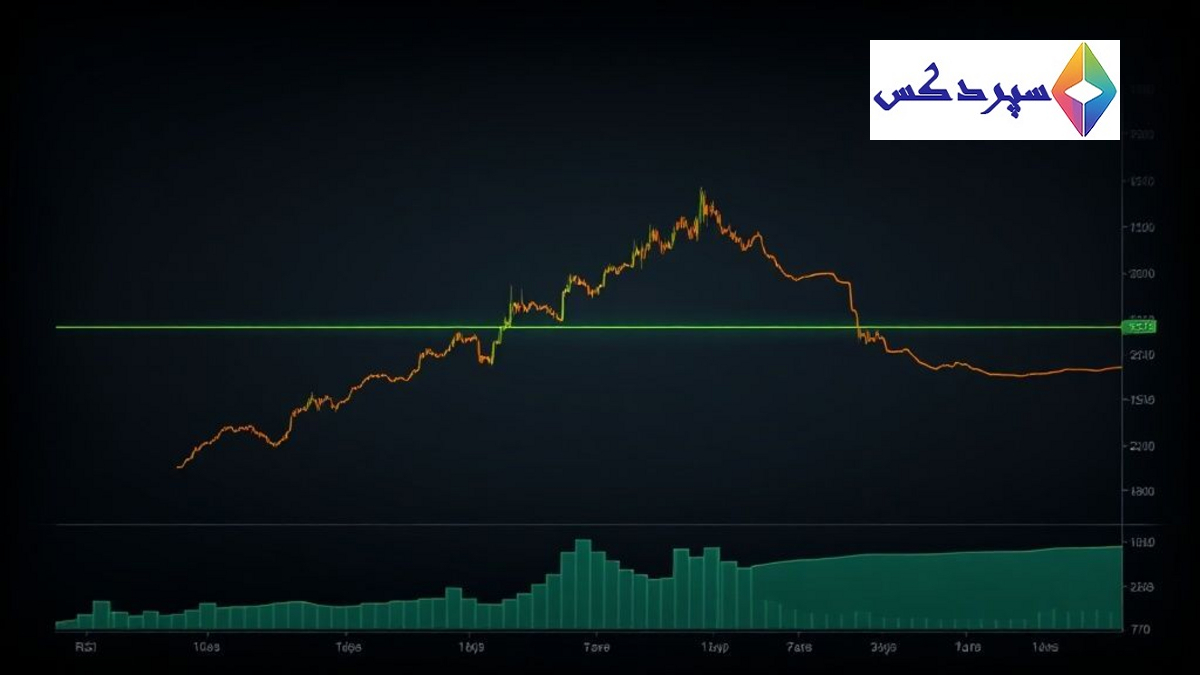
On the 1-hour chart, price moves within a downtrend channel and is nearing the channel bottom. A breakout above the channel is expected to complete the inverse head and shoulders pattern and retest the upper boundary. This breakout could signal a temporary shift to the upside and may prepare traders to extend the move in the subsequent stages.
The RSI indicator is trending downward but has approached the lower edge, suggesting a potential bounce back toward the upside. This combination often brings short-term volatility and creates entry opportunities for traders, provided risk management is well executed.
A key green support zone sits at 0.005970. The price has reacted to this area several times in the past, and based on those historical reactions, it is likely to respond positively again in the future. This point serves as a critical reference for setting stop losses and identifying entry levels.
As price progresses, there is a trend toward consolidation and a converging with the 100-period moving average, which supports short-term price gains. This indicates rising buying pressure and potential movement toward the stated targets.
Suggested entry price: 0.006098
Target 1: 0.006210
Target 2: 0.006396
Target 3: 0.006597
Forming a cohesive capital management strategy is the first step to success. Therefore, it is advisable to place the stop loss below the green support zone to reduce risk and guard against sharp price declines.
If you have questions or would like to share your views, please leave a comment below so we can deepen the discussion.
Key Trading Tips
- Entry price: 0.006098
- Target 1: 0.006210
- Target 2: 0.006396
- Target 3: 0.006597
Related Links and Sources
To review headlines and reliable sources, you can use the following links:
FAQ
What is the inverse head and shoulders pattern and how does the breakout occur on MYRO/USDT?
The 1-hour chart shows price moving in a downtrend channel, and a breakout above the channel is expected to complete the inverse head and shoulders pattern and re-test the upper boundary. This breakout typically signals a temporary bullish reversal and may prepare traders to extend the move in later stages.
What signals on the 1-hour chart confirm the breakout from the downtrend channel?
Key signals include a breakout above the upper boundary of the downtrend channel and a subsequent retest of that boundary. This is usually accompanied by the RSI approaching the lower zone and a potential price bounce. The convergence toward the 100-period moving average can also confirm short-term support.
What role does the 0.005970 key support area play in entry and stop-loss decisions?
The green key support area acts as a historical reactive zone. Given its past reactions, it is likely to respond positively again in the future. Traders use this point to set stop losses and inform entry decisions to limit risk.
What are the entry price and price targets, and how are they used with risk management?
The suggested entry is 0.006098, with targets at 0.006210, 0.006396, and 0.006597. For risk management, placing the stop loss below the green support zone helps prevent sharp losses and preserves capital.
What is the role of the 100-period moving average in this analysis and how does it aid decisions?
The trend toward alignment with the 100-period moving average indicates rising near-term buying pressure and can guide price movement toward the defined targets. This convergence provides a supportive confirmation for a short-term bullish bias.
What if the price fails to break out of the downtrend channel or reverses lower?
If breakout fails or the price moves downward again, traders should adhere to risk management principles, revisit entry levels, reassess support zones, and consider resetting targets. Maintaining awareness of stop-loss placement and making minor input adjustments can limit losses and protect capital.
Comments