

Nvidia (NVDA) Stock Analysis: Potential Breakout Above $190 Resistance
Nvidia (NVDA) Stock Analysis: Potential Breakout Above $190 Resistance
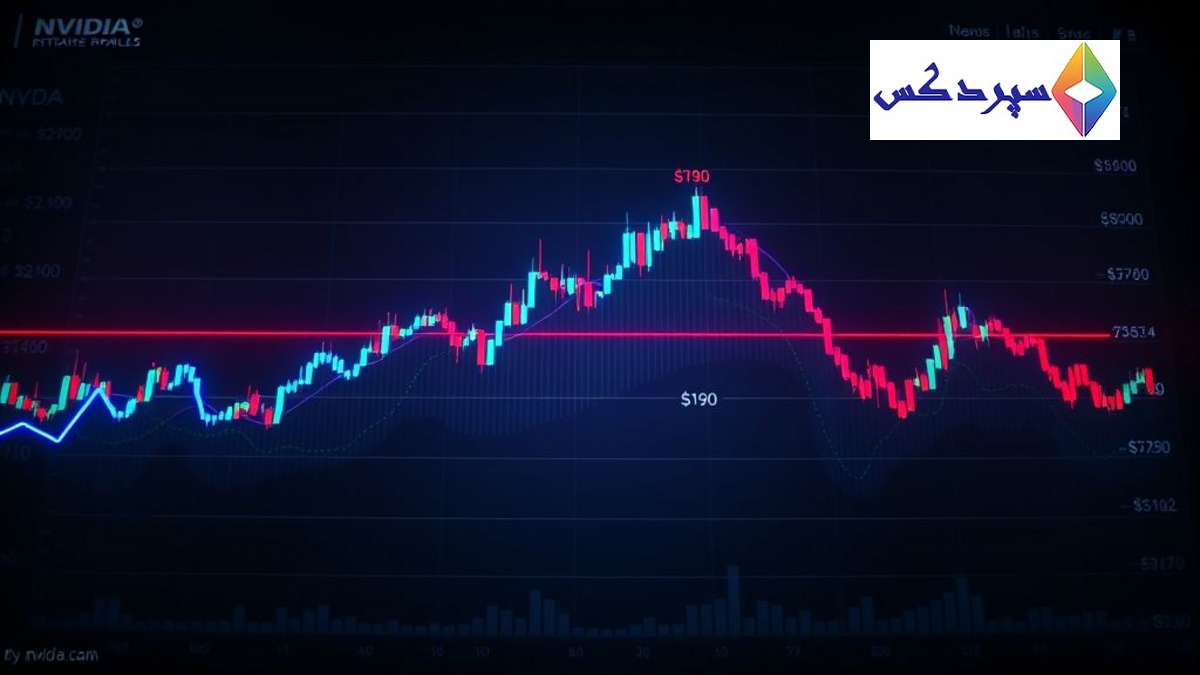
Nvidia (NVDA) stock continues to trade with strong bullish momentum, consolidating just below the critical $190 resistance level. This area is reinforced by previous liquidity grabs and gamma resistance. Today’s price action for Nvidia stock shows tight price compression between $188 and $189.50, signaling a potential launch for a breakout in the next session. This comprehensive article provides a **technical analysis** of Nvidia stock.
Market Structure and NVDA Price Action
On the 15-minute chart, NVDA respects a bullish trendline from yesterday’s low, indicating sustained upward control throughout the day. The one-hour structure reveals a clean range between $185.75 (support) and $189.50 (resistance). A break from this range could initiate a measured move towards $192-$195. The MACD indicator on the 15-minute chart is crossing bullishly with increasing histogram momentum, while the Stoch RSI remains high but not yet overextended. This signal suggests potential continuation before any pullback.
Key Support and Resistance Levels for NVDA Stock
Investors and traders of Nvidia stock should pay close attention to the following **stock support** and **stock resistance** levels:
- **Immediate Resistance:** $189.41 → $190.36 (Short-term breakout zone)
- **Major Resistance (Gamma Wall):** $192.5 → $195
- **Immediate Support:** $186.89 → $185.75
- **Key Support Zone:** $184.4 → $182.8
GEX Analysis and Options Trading Sentiment
The highest positive Call Gamma concentration sits between $192.5 and $195, aligning with the observed overhead resistance. Put support remains dense at $182-$180, forming a solid gamma floor. IVR stays low at 12.2, and call positioning is slightly higher than put (13.5% call bias), indicating traders are positioning bullishly but cautiously. The **GEX** trend supports bullish momentum, allowing NVDA to climb towards the $190-$192.5 region if SPY continues to strengthen, provided $185 holds. For related news headlines and their market impact, visit our news section.
Trading Scenarios: Bullish and Bearish Setups for NVDA
Bullish Setup (Long Trade)
- **Entry:** Above $189.50 after confirmation of a breakout
- **Target 1:** $192.5
- **Target 2:** $195
- **Stop Loss:** Below $186.8
- **Logic:** Trendline support, bullish MACD, and strong GEX alignment support a continued breakout. Understanding reports and analysis helps you better grasp **options trading** strategies.
Bearish Setup (Short Trade)
- **Entry:** Below $185.75 (retest of breakdown)
- **Target 1:** $184.4
- **Target 2:** $182
- **Stop Loss:** Above $187
- **Logic:** Price rejection at $189-$190 coupled with MACD divergence could initiate a short-term pullback to fill lower liquidity pockets.
NVDA’s price action shows controlled consolidation below a key resistance, indicating potential for continued breakout towards $192-$195 if momentum holds. Monitor SPY’s direction for confirmation; any weakness in SPY could cause NVDA to retest $185 before continuing its upward move. Currently, bulls control the **market analysis**. Source
Disclaimer: This analysis is for educational purposes only and does not constitute financial advice. Always conduct your own research and manage your risk before making any trades.
سوالات متداول (FAQ)
What is the current market outlook for Nvidia (NVDA) stock based on this analysis?
The analysis indicates strong bullish momentum for Nvidia (NVDA) stock, with the price consolidating just below the critical $190 resistance level. There is tight price compression between $188 and $189.50, signaling a potential breakout in the near term towards higher resistance levels, provided momentum holds.
What are the critical support and resistance levels for NVDA stock that traders should monitor?
Key resistance levels include immediate resistance at $189.41-$190.36 (short-term breakout zone), and a major resistance (gamma wall) at $192.5-$195. Important support levels are immediate support at $186.89-$185.75, and a key support zone between $184.4-$182.8.
How does GEX analysis influence the bullish sentiment for NVDA stock?
GEX analysis shows a high positive Call Gamma concentration between $192.5 and $195, aligning with observed overhead resistance. Dense Put support at $182-$180 forms a solid gamma floor. A 13.5% call bias indicates traders are cautiously bullish, and the GEX trend supports upward movement towards the $190-$192.5 region, provided the broader market (SPY) strengthens and $185 holds as support.
Can you describe the bullish and bearish trading scenarios outlined for NVDA stock?
For a bullish setup, a long trade is suggested above $189.50 after breakout confirmation, with target 1 at $192.5 and target 2 at $195, and a stop loss below $186.8. The logic is based on trendline support, bullish MACD, and strong GEX alignment. For a bearish setup, a short trade is considered below $185.75 (retest of breakdown), with target 1 at $184.4 and target 2 at $182, and a stop loss above $187. This scenario assumes price rejection at $189-$190 coupled with MACD divergence, potentially initiating a short-term pullback.
Comments