

Bitcoin (BTC/USD) 15-Minute Price Chart Analysis: Key Signals and Trends
Bitcoin (BTC/USD) 15-Minute Price Chart Analysis: Key Signals and Trends
In the dynamic world of cryptocurrencies, real-time chart analysis is crucial for traders. The Bitcoin (BTC/USD) 15-minute chart serves as a powerful tool for understanding short-term fluctuations and making quick decisions. In this detailed Bitcoin 15-minute chart analysis, we meticulously examine the Bitcoin chart, identifying price patterns and key levels to gain a better understanding of future BTC price movements. Always follow reliable sources for up-to-date crypto market news and related headlines.
BTC/USD 15-Minute Technical Analysis Summary
Based on a precise review of training and analysis reports from the Bitcoin 15-minute chart, we highlight the following key points:
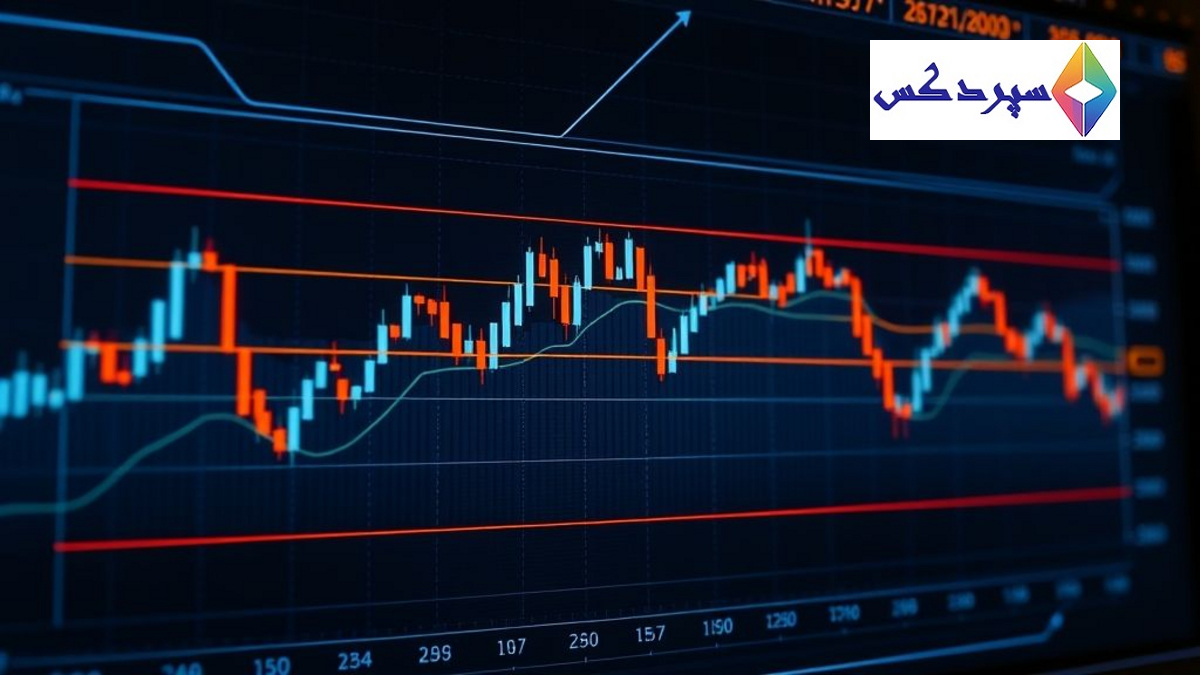
- Formation of Bullish Price Channels: We observe two clear bullish price channels, marked with points A-B-C-D, indicating a prevailing bullish momentum in the market. These channels often precede a price breakout (either bullish or bearish), depending on the dominant market sentiment.
- Key Supply (Resistance) Zones: A significant supply/resistance zone exists between $115,800 and $116,400. The Bitcoin price has repeatedly faced rejection in this area. Recently, a bearish rejection candle (wick) appeared in this range, signaling potential bearish pressure. This zone acts as a crucial Bitcoin resistance level.
- Identification of Potential Demand (Support) Zones: We identified a demand/support zone within the $114,200 to $114,800 range. When Bitcoin pulls back to this area, we anticipate increased buying interest and Bitcoin support. These are vital supply and demand zones for traders.
- Bearish Rejection Candle Signal: After touching the upper resistance zone, a strong bearish rejection candle (red vertical line) emerged. This signal could indicate a short-term Bitcoin pullback and warrants a more detailed 15-minute analysis.
Overall Bitcoin Market Trend Outlook and Future Predictions
Despite the recent bullish Bitcoin trend, the price’s failure to break above the $116,400 resistance level may lead to a retreat and a pullback towards the lower demand zone, especially if selling pressure persists. Traders should closely monitor price reactions at these key levels and prepare for various scenarios. Understanding these supply and demand zones is crucial for informed decision-making in BTC/USD trades. This type of Bitcoin technical analysis is essential for identifying short-term trading opportunities.
Analyzing short-term charts, such as the BTC/USD 15-minute chart, provides valuable insights for traders. However, we always recommend combining these analyses with other technical and fundamental tools. The information in this article originates from news sources and available analyses and should not be considered financial advice.
Frequently Asked Questions (FAQ)
Why is Bitcoin (BTC/USD) 15-Minute Chart Analysis important for traders?
Bitcoin (BTC/USD) 15-Minute Chart Analysis is a powerful tool for understanding short-term fluctuations and making quick decisions in the dynamic world of cryptocurrencies. This analysis helps traders identify price patterns and key levels for a better understanding of Bitcoin’s future price movements.
What is the significance of supply and demand zones in Bitcoin’s 15-minute analysis?
Supply (resistance) and demand (support) zones are crucial for traders. The supply zone between $115,800 and $116,400 has acted as a key resistance where the price has repeatedly faced rejection. Conversely, the demand zone between $114,200 and $114,800 is identified as potential support, where we expect increased buying interest during pullbacks. Understanding these zones is essential for informed decision-making in BTC/USD trades.
What does the formation of bullish price channels on the Bitcoin 15-minute chart signify and what signal does it give?
The formation of two clear bullish price channels on the Bitcoin 15-minute chart indicates upward momentum in the market. These channels are often considered a precursor to a price breakout (either bullish or bearish) depending on the prevailing market sentiment.
What does a bearish rejection candle signal in the recent BTC/USD analysis?
After touching the upper resistance zone, a strong bearish rejection candle appeared. This signal can indicate a short-term Bitcoin pullback and points to potential downward pressure on Bitcoin’s price. Traders should closely monitor price reactions under these conditions.
What is the overall Bitcoin market outlook given the failure to break the $116,400 resistance?
Despite the recent bullish trend, the price’s inability to break above the $116,400 resistance level may lead to a retreat and a pullback towards the lower demand zone, especially if selling pressure continues. Traders should closely monitor price reactions at these key levels and be prepared for various scenarios.
Comments