

Solana (SOL) Technical Analysis: Examining a Key Support Level
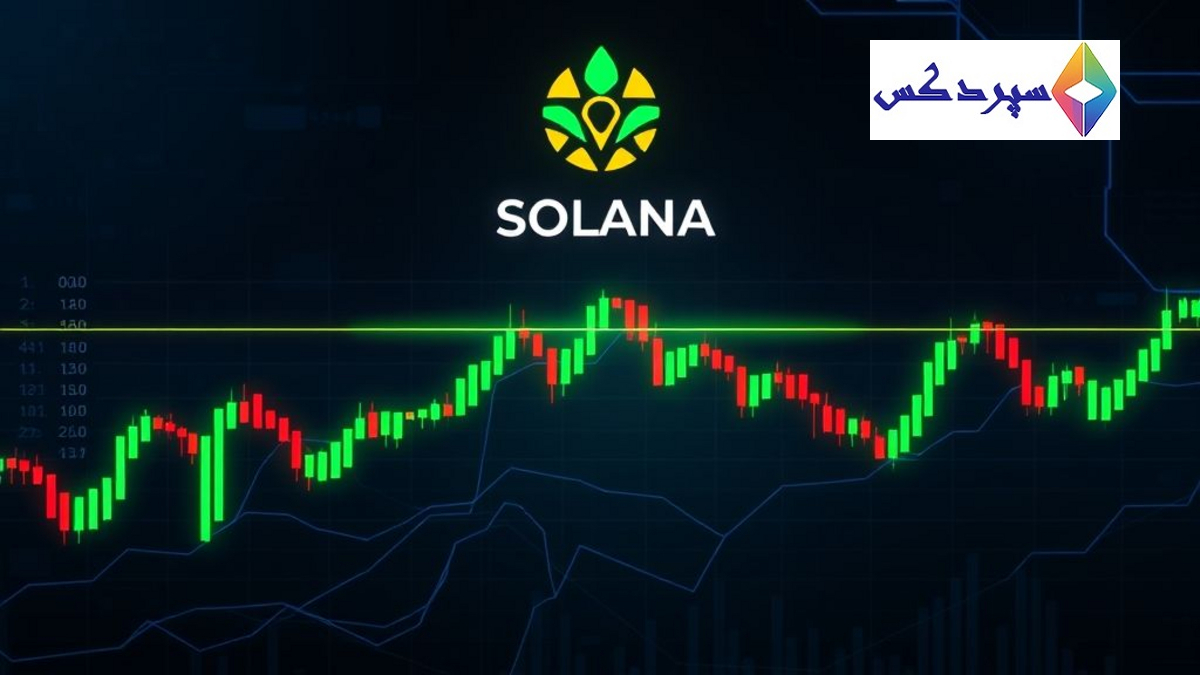
Solana (SOL) Technical Analysis: Examining a Key Support Level
The cryptocurrency market constantly presents opportunities and volatility. Investors and traders often turn to technical analysis tools to better understand price movements and make informed decisions. In this article, we focus on Solana (SOL), a popular digital asset, and explore its current status from a technical analysis perspective. Solana’s weekly chart has now reached a significant support level, which could mark a turning point for its future price action.
Importance of Technical Analysis in the Cryptocurrency Market
Technical analysis is a powerful tool traders use to predict future patterns and trends based on historical price and volume data. This type of crypto technical analysis helps us identify key levels like support and resistance, and is crucial for effective crypto trading analysis. Support levels are points on a chart where buyers tend to enter the market, preventing further price declines, while resistance levels are where sellers step in, halting price increases.
- Identify optimal entry and exit points
- Understand market psychology
- Forecast potential trends
- Improve risk management
Current State of Solana (SOL) on the Weekly Chart
By reviewing related news headlines and the weekly Solana chart (SOL), we observe that the price has encountered a major Solana support level. This support level has historically played a crucial role in price reversals, acting as a price floor. Reaching this level suggests that selling pressure is diminishing, and buyers might re-enter the market. Maintaining this SOL support is vital to prevent further price depreciation for Solana (SOL).
Analyzing the Solana chart reveals that this cryptocurrency has been moving within a defined channel or range. Reaching the bottom of this channel or a strong support zone typically presents an opportunity for a price rebound, provided there is sufficient buying power.
Potential Scenarios: Holding or Breaking Support
At this critical juncture, we envision two main scenarios for Solana price action:
Holding the Support Level
If Solana (SOL) successfully holds above this key support level, we will likely see a price reversal and an upward movement. This scenario could lead to the formation of a new uptrend or at least a price consolidation at higher levels. In this case, traders will look for signs of increased trading volume and bullish candlestick patterns to confirm buyer strength. Sustaining this level could indicate the potential for future growth for Solana, influencing its SOL price prediction.
Breaking the Support Level
Should Solana fail to maintain this support level and its price falls below it, we will likely witness a continuation of the downtrend and further price declines. A break of a significant support level can trigger more sell orders, pushing the price towards lower support levels. In such circumstances, analysts will seek to identify subsequent support levels on the chart to predict potential stopping points for the decline.
Other Indicators and Influencing Factors
For a more comprehensive SOL technical analysis, we must also consider other indicators:
- Trading Volume: An increase in volume when hitting support can signal strong buying interest.
- Relative Strength Index (RSI): If the RSI is in the oversold region, a price reversal becomes more probable.
- Moving Averages: Examining the price’s position relative to key moving averages can reveal long-term trends.
- News and Events: News related to the Solana ecosystem or the broader cryptocurrency market analysis also influences price trends.
Final Note and Disclaimer
Technical analysis serves only as a tool to aid decision-making and offers no guarantee of future price movements. The cryptocurrency market is highly volatile and risky, and investors must always act with full awareness and appropriate risk management. This article is for informational purposes only and does not constitute financial or investment advice. Before making any decisions, conduct your own research and consult with a financial advisor if necessary.
Frequently Asked Questions (FAQ)
What is technical analysis and why is it important in the cryptocurrency market?
Technical analysis is a powerful tool that traders use to predict future patterns and trends based on historical price and volume data. This analysis helps identify key levels like support and resistance, understand market psychology, forecast potential trends, and better manage risk.
What is the current technical analysis status of Solana (SOL) on the weekly chart?
Based on the weekly chart analysis, Solana (SOL) price has currently reached a major and key support level. This level has historically played an important role in price reversals, acting as a price floor. Maintaining this level is crucial to prevent further price depreciation for Solana and indicates a decrease in selling pressure.
What are the potential scenarios for Solana’s price trend at the key support level?
At this critical stage, two main scenarios are envisioned: 1. Holding the support level: If Solana can remain above this key level, we will likely see a price reversal and an upward movement, or at least price stabilization at higher levels. 2. Breaking the support level: If the price falls below this level, we will likely see a continuation of the downtrend and further price declines towards lower support levels.
For a more comprehensive technical review of Solana, what other indicators should be considered besides support and resistance levels?
For a more comprehensive SOL analysis, other indicators should be considered, such as trading volume (increased volume upon hitting support is a sign of buyer strength), Relative Strength Index (RSI) (if in the oversold region, a reversal is more likely), Moving Averages (to identify long-term trends), and news and events related to the Solana ecosystem or the broader cryptocurrency market.
Comments